
Applies to: Windows 7+, Windows Server 2008 R2+
Target audience: People I support primarily. Anyone who wants to perf like a pro?
Step 1: Get the Windows Performance Toolkit, by way of the Windows Assessment and Deployment Kit. Since every iteration of the WPT happens to be distributed slightly differently than the previous version, I’ve included the MSFT guide on getting the most recent as a link. As it stands now, run through the web installer and uncheck everything but “Windows Performance Toolkit”.
It is worth noting that the resulting Windows Kits folder with the WPT in it is typically portable. Meaning once you install, you can usually copy/paste the folder to another host without going through the web installer again. There are also redist executables to install just the WPT for ‘next time/next system’ as well.
Step 2: Open WPRui (Start/WPRUI/enter)
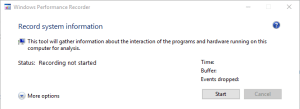
Step 3: Expand the “More Options” caret.
- Expand Resource Analysis.
- Select “CPU Usage”,
- Select “Disk I/O Activity”,
- Select “File I/O Activity”
- Expand Scenario Analysis.
- Select “Minifilter I/O activity”
Step 3a: Optionally I may have you skip this and click “Add Profiles…” and add a custom XML instead of check individual boxes.
Step 4: Validate the Performance Scenario is “General”, Detail Level is “Verbose” and Logging mode is “Memory”.
Step 5: Click “Start” and then reproduce the ‘bad behavior’.
Step 6: Let the collection run for the amount of time I gave you (or a couple minutes) and then click stop.
Step 7: Wait.
Zip and upload the resulting ETL file and the same-named NGEN.PDB folder (if present) to me.
Leave a Reply